Example usage
To illustrate the functionalities of qv_helper, the Palmer penguins dataset will be used.
from palmerpenguins import load_penguins
df = load_penguins()
df.head(3)
| species | island | bill_length_mm | bill_depth_mm | flipper_length_mm | body_mass_g | sex | year | |
|---|---|---|---|---|---|---|---|---|
| 0 | Adelie | Torgersen | 39.1 | 18.7 | 181.0 | 3750.0 | male | 2007 |
| 1 | Adelie | Torgersen | 39.5 | 17.4 | 186.0 | 3800.0 | female | 2007 |
| 2 | Adelie | Torgersen | 40.3 | 18.0 | 195.0 | 3250.0 | female | 2007 |
qv_groups
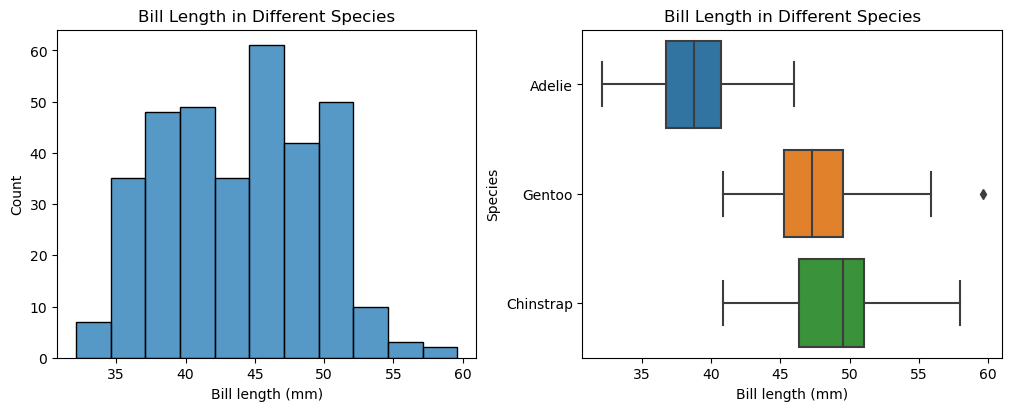
qv_groups take 1 numeric variable and 1 categorical variable to build a histogram for the numeric variable and a boxplot of the numeric variable grouped by the categorical variable. When there are more than 2 classes in the grouping variable, a one-way ANOVA test will be performed.
from qv_helper.qv_helper import qv_groups

qv_groups(value='bill_length_mm', group='species', data=df, title='Bill Length in Different Species',
            xlabel='Bill length (mm)', ylabel='Species')
Null values are dropped in statistical tests.
Test                F       p
-------------  ------  ------
One-way ANOVA  397.30  0.0000
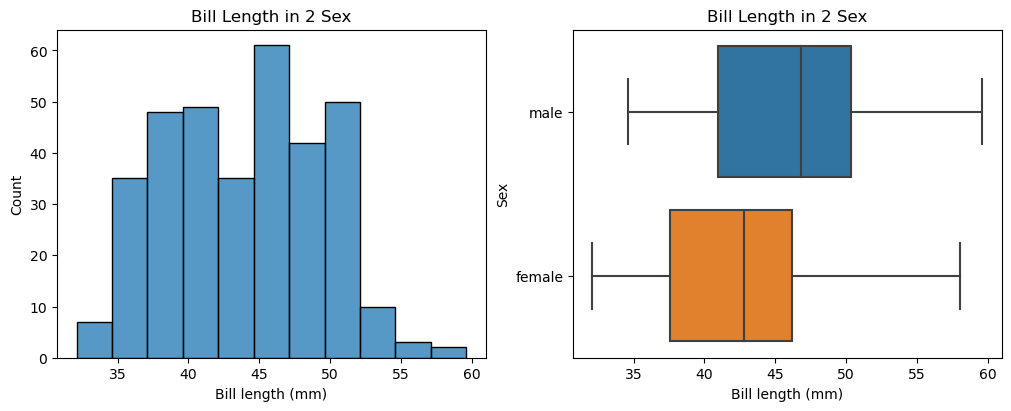
When there are only 2 groups, t-tests will be performed automatically.
qv_groups(value='bill_length_mm', group='sex', data=df, title='Bill Length in 2 Sex',
            xlabel='Bill length (mm)', ylabel='Sex')
Null values are dropped in statistical tests.
Test                       t       p
----------------------  ----  ------
Equal var. assumed      0.00  1.0000
Equal var. not assumed  0.00  1.0000
qv_scatter
qv_scatter takes 2 numeric values as arguments and plot the corresponding scatter plot. 2 correlation statistics will be printed based on the needs of users.
from qv_helper.qv_helper import qv_scatter

qv_scatter(valuex='bill_length_mm', valuey='bill_depth_mm', data=df, title='Relationship between Bill Length and Bill Depth',
        xlabel='Bill Length (mm)', ylabel='Bill Depth (mm)')
Null values are dropped in statistical tests.
Test                r       p
------------  -------  ------
Pearson's r   -0.2286  0.0000
Spearman's r  -0.2139  0.0001

qv_2cat
qv_2cat takes 2 categorical variables as arguments and plot the corresponding heatmap and a stacked barchart for to illustrate the proportion of each class in groupx in groupy. When both of the categorical variables are with exactly 2 classes, Barnard’s exact test and Fisher’s exact test will also be performed.
from qv_helper.qv_helper import qv_2cat

qv_2cat(groupx='species', groupy='island', data=df, title_heatmap='Count of each Species on each Island',
    title_bar='Proportion of each Species on each Island', xlabel='Species', ylabel='Island')
Test              Test statistic      Value    df       p
----------------  ----------------  -------  ----  ------
Chi-squared test  Chi-squared        299.55     4  0.0000

qv_count
qv_count takes 1 categorical variable as argument and plot a barchart. The count in numeric values will also be printed and supplemented by the the number of null values.
from qv_helper.qv_helper import qv_count

qv_count(value='species', data=df, title='Count of each Species', label='Species')
Group        Count
---------  -------
Adelie         152
Gentoo         124
Chinstrap       68
NA               0

qv_dist
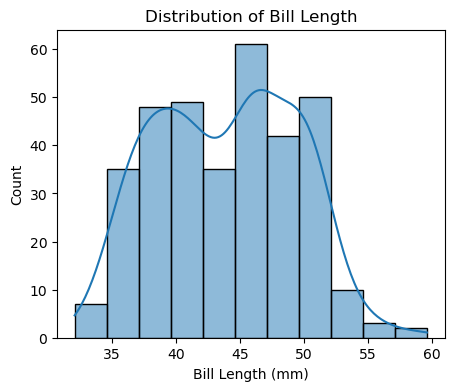
qv_dist takes 1 numeric variable as argument and plot a histogram. Summary statistics will be printed as well.
from qv_helper.qv_helper import qv_dist

qv_dist(value='bill_length_mm', data=df, title='Distribution of Bill Length', label='Bill Length (mm)')
Null values are dropped in the chart and statistics.
Statistics      Value
------------  -------
Mean            43.99
Variance        29.82
Sample size    333.00
# of NAs         0.00
Skewness         0.05